Investment Index
Investment Index - Dividend for Past 3 years
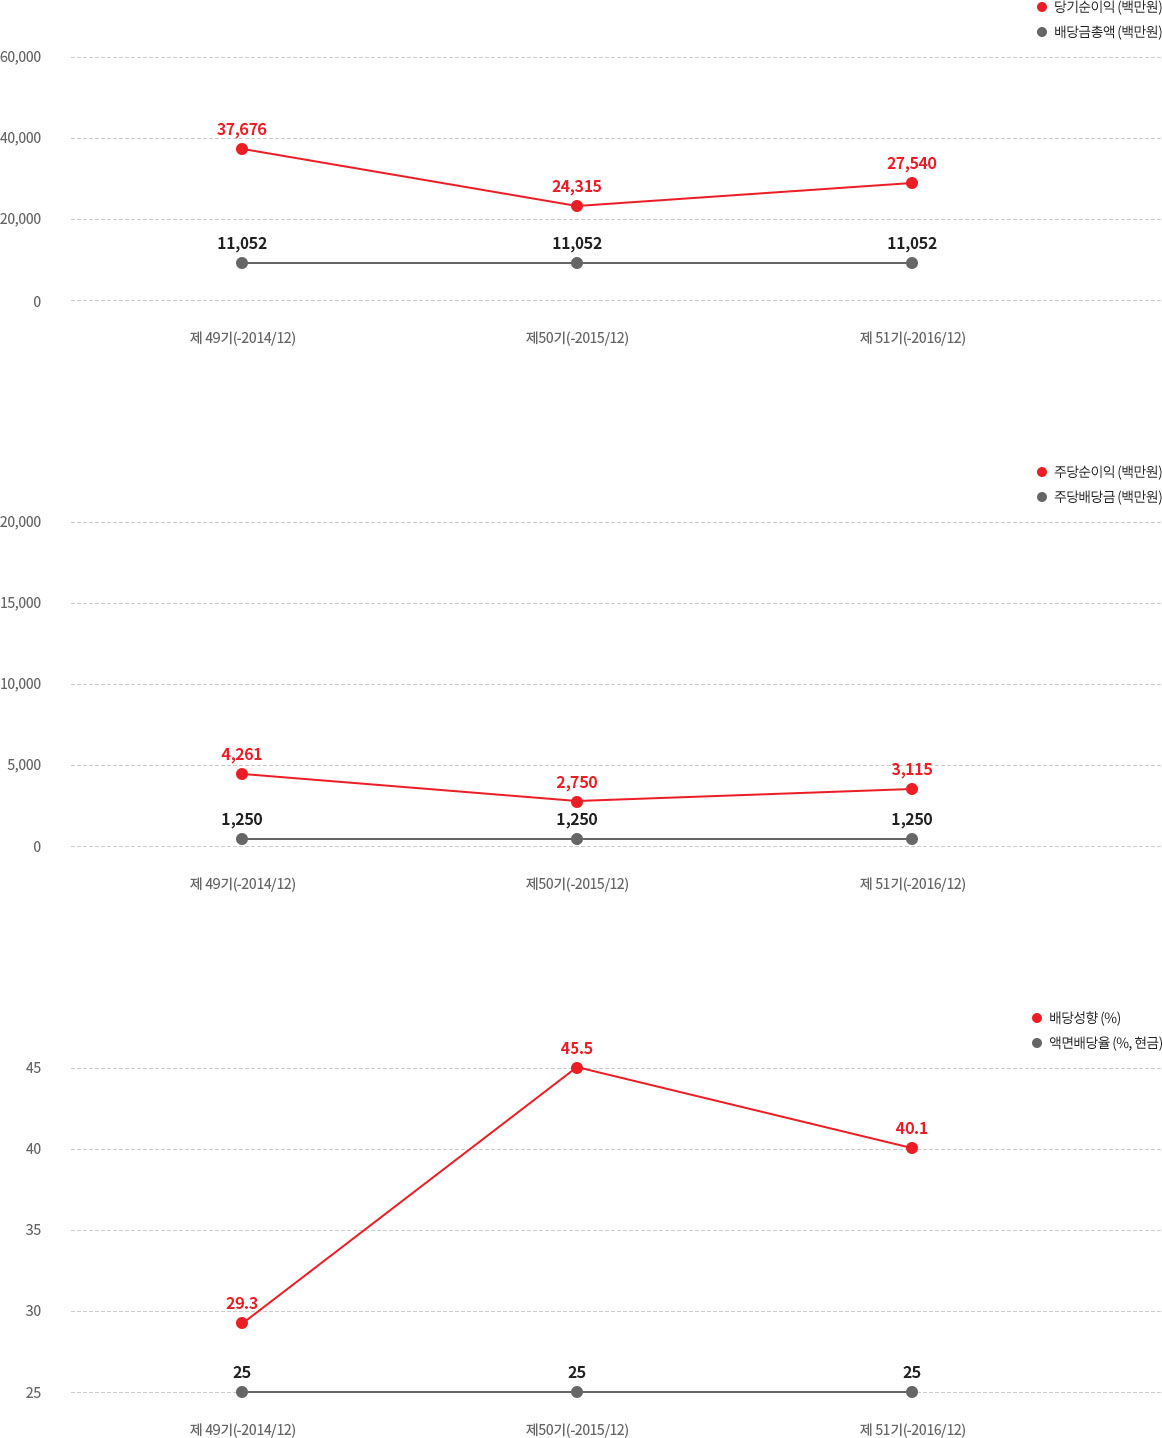
Dividend for Past 3 years
| Type |
The 49th (~2014/12) |
The 50th (~2015/12) |
The 51th (~2016/12) |
| Current Net Profit (1M KRW) |
37,676 |
24,315 |
27,540 |
| EPS (1M KRW) |
4,261 |
2,750 |
3,115 |
| Total Dividend Amount (1M KRW) |
11,052 |
11,052 |
11,052 |
| Payout Ratio (%) |
29.3 |
45.5 |
40.1 |
| Dividend per Share (1M KRW) |
1,250 |
1,250 |
1,250 |
| Nominal Value Payout Ratio (%) |
Cash |
25.0 |
25.0 |
25.0 |
| stock |
- |
- |
- |
Investment Index - Dividend for Past 3 years
Dividend for Past 3 years
| Current Net Profit (1M KRW) |
| The 49th (2016/12) |
37,676 |
| The 50th (2016/12) |
24,315 |
| The 51th (2016/12) |
27,540 |
| EPS (1M KRW) |
| The 49th (2016/12) |
4,261 |
| The 50th (2016/12) |
2,750 |
| The 51th (2016/12) |
3,115 |
| Total Dividend Amount (1M KRW) |
| The 49th (2016/12) |
11,052 |
| The 50th (2016/12) |
11,052 |
| The 51th (2016/12) |
11,052 |
| Payout Ratio (%) |
| The 49th (2016/12) |
29.3 |
| The 50th (2016/12) |
45.5 |
| The 51th (2016/12) |
40.1 |
| Dividend per Share (1M KRW) |
| The 49th (2016/12) |
1,250 |
| The 50th (2016/12) |
1,250 |
| The 51th (2016/12) |
1,250 |
| Nominal Value Payout Ratio (%) |
| Cash |
| The 49th (2016/12) |
25.0 |
| The 50th (2016/12) |
25.0 |
| The 51th (2016/12) |
25.0 |
| stock |
| The 49th (2016/12) |
- |
| The 50th (2016/12) |
- |
| The 50th (2016/12) |
- |